Success In semiconductor manufacturing can often hinge on the smallest of details. In the late 1990s, a change in a single chemical in a single clean cycle almost resulted in the ruin of one of the world’s largest semiconductor companies.
Here’s the story: A new technology was working nicely in an R&D fab, but once it was transferred to the production fab it was yielding quite poorly. After three months and hundreds of experiments with wafers being overnighted back and forth, the yield still wasn’t good enough to launch the product. With about 10 billion in today’s money spent on that factory and an already delayed launch cycle, the company was at the brink of failure.
After a few more months of around-the-clock investigation, the problem was finally solved – the culprit was the single chemical. The company survived and is a leader today.
The lesson learned? “No matter how smart your engineers are, if they don’t have the right tools – the technology to help them find insights into huge volumes of heterogeneous technical data — you may never find the answers to your company’s most difficult challenges,” said Brad Hopper, VP of vertical markets at Spotfire. Hopper, who was deeply involved in finding the solution at the time, recalled the events in a new webinar series called The Analytics Forum (TAF) available on the Spotfire website. https://www.spotfire.com/ events/taf
Today, such at-the-brink-of-failure stories are rare, but devices, processes and equipment have only become more complex and plenty of problems still exist on a daily basis. The amount of data that needs to be generated and analyzed to solve these problems can be overwhelming. “If you just think about all of the different kinds of data involved, it’s unbelievable,” Hopper said. “Temperature, pressure, gas flow rates, RF power, spectrometry, thickness uniformity, material properties, mainte- nance, consumables, parts and spares, defects, parametric data, bin data, bitmap data, functional data, testers, probe cards, recipes, limits, specifications, and it goes on and on,” he said.
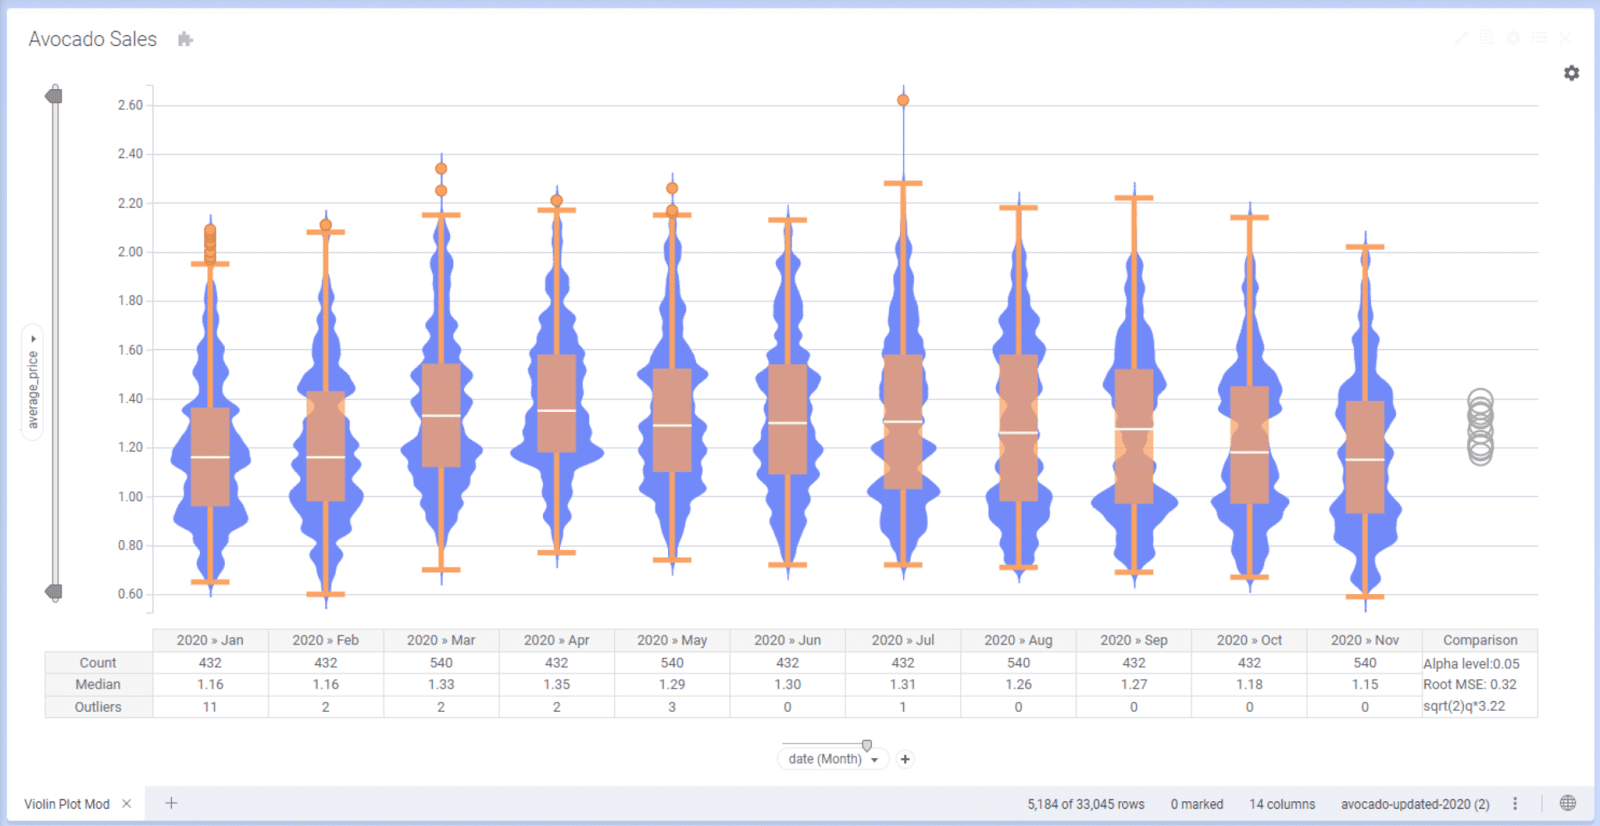
A new approach called visual data science — embodied in the Spotfire® platform — is designed to make ana- lyzing vast amounts of data easier and faster, and more readily shared. It takes advantage of the fact that the human brain can process entire images that the eye sees for as little as 13 milli- seconds. By combining a visual data representation such as a wafer map with sophisticated data analysis, users can quickly “spot the fire” in large amounts of data, says Michael O’Connell, the chief analytics officer at Spotfire. “You connect to data, visualize it, transform it — you twist and turn and morph your way around that, spotting the fire in the data — and then you model, filter, mark, slide, model and predict, and you have an application then that you can distribute for people to do their daily, round-the-clock decision-making,” O’Connell said. “It helps you think and get to the action in the data.” In the TAF webinar series, O’Connell provided an executive overview of visual data science (https://www.spotfire.com/ resources/taf-visual-data-science).
Click here to read the full article in Semiconductor Digest magazine.
