IC Insights proudly celebrates its 25th anniversary by offering the 2022 edition of The McClean Report service. The McClean Report service begins with the Semiconductor Industry Flash Report, which will be released in January of next year, and will provide clients with IC Insights’ initial overview and annual forecast of the semiconductor industry for the upcoming year and through 2026. In addition to the Flash Report, Quarterly Updates to the report will be released in February, May, August, and November of 2022.
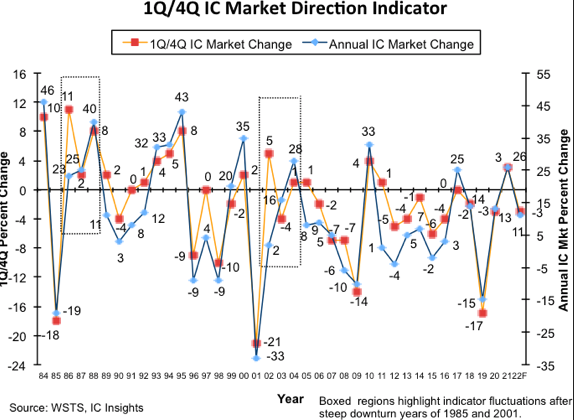
Figure 1 shows the 1Q/4Q IC market direction indicator that IC Insights developed 24 years ago. The figure is labeled as a “direction indicator” because the actual 1Q/4Q change does not directly forecast the eventual annual IC market growth for a given year, but instead more accurately describes the expected direction and intensity of the annual IC market growth rate as compared to the previous year. For example, 2017 showed 0% 1Q/4Q growth and 25% annual IC market growth, whereas 2011 displayed 1% 1Q/4Q growth but a full year IC market growth rate of only 1%, the difference being the 1Q/4Q change as compared to the previous year’s 1Q/4Q change.
Excluding the years after the severe IC industry downturns of 1985 and 2001, IC Insights believes that the 1Q/4Q sequential quarterly IC market change is a good indicator of the direction and intensity of the future annual IC market change. The reason why this model is a good indicator of the direction of the IC industry’s annual growth rate lies in the seasonality of the IC market itself. Given the typical quarterly seasonal pattern that is characteristic of the IC industry, the first quarter essentially establishes a “base” upon which future quarterly IC market growth will build.
Overall, when the 1Q/4Q performance of a given year is better than the previous year’s 1Q/4Q result, the annualgrowth rate for that year can be expected to be better than the previous year. The opposite is usually true when the 1Q/4Q performance of the current year is worse than the year earlier.

From 1984-2020, the average seasonal sequential decline in the 1Q/4Q IC market was 2%. In 1Q20, the IC market was down 3% compared to 4Q19, slightly below the historical average. The 1Q21/4Q20 IC market change of 3% was much better than the 1Q20/4Q19 IC market change of -3%. As a result, IC Insights believes that the full-year annualgrowth rate for the 2021 IC market will likely be much better (26%) than the 13% increase the IC market registered in 2020. Conversely, since the 1Q22/4Q21 IC market is forecast to be down 3%, the IC market direction indicator depicts the 2022 IC market growing much less than it did in 2021 (11% in 2022 versus 26% in 2021). If 1Q22/4Q21 IC market growth surprises to the upside of -3%, an upgrade to our current 11% forecast for next year may be warranted.
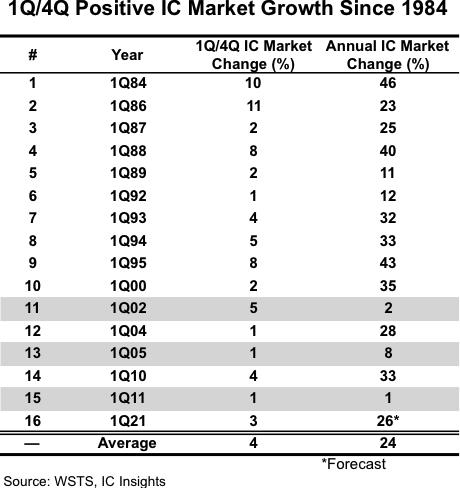
It is worth noting that the total 1Q21/4Q20 IC market increase of 3% was the first positive 1Q/4Q IC market increase since 2011 (Figure 2). As shown, of the 15 previous positive 1Qs since 1984, all but three of those years (shaded in the chart) ended up with the IC market registering strong double-digit growth for the full-year. For 2021, IC Insights is currently forecasting an IC market increase of 26%, which is slightly above the 24% average annual IC market growth rate in years since 1984 where 1Q/4Q IC market growth was positive.
Although the first quarter of the year is typically thought of as a “down” quarter sequentially due to seasonal factors, a positive 1Q/4Q IC market is not a rare event. During the 38-year timespan of 1984 through 2021 there have been 16 positive 1Q/4Q IC market increases (42% of the time). Even when narrowing the timespan to a more recent timeframe of 2000-2021, there have been seven times where the 1Q/4Q IC market changes were positive.
